Navigation Analytics shows how visitors use wayfinding inside your 3D tour: how many people opened it, which areas they navigated to most, whether they reached their destination, and which devices they used. It covers both on-site Kiosk screens and visitors on Web / Mobile, so you can see where people want to go and where navigation needs improvement.
How to Open Navigation Analytics?
Open the tour's Manage section → click the Analytics icon → select Navigation Analytics in a drop-down menu.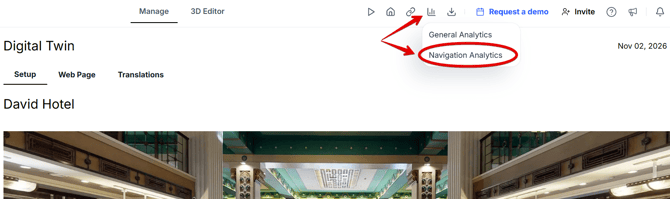
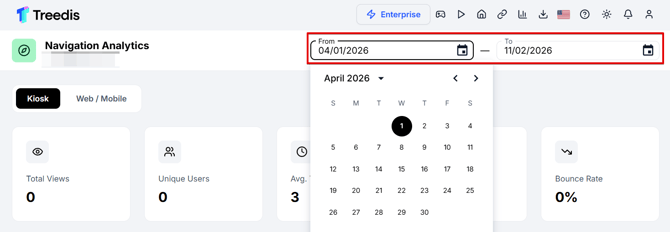
The Navigation Analytics page by default shows data for the last 7 days. Select the time range for the stats to analyze: go to the calendar → select the dates you are interested in → the system will automatically refresh the page to display the data.
Kiosk vs Web / Mobile
Use the toggle at the top of the page to switch between the two data sources:
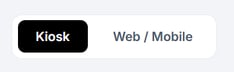
Kiosk - navigation sessions started on on-site kiosk screens. This tab shows: Summary, Activity Over Time, Kiosk Entries, Popular Areas (Top Tags) and Latest Feedback.
Web / Mobile - navigation sessions started from a browser on a computer or phone. This tab shows: Summary, Activity Over Time, Device Breakdown, Navigation Success, Error Rate, Popular Areas (Top Tags) and Latest Feedback.
Summary

Total Views - how many times the tour was opened within the time range. The same user can make several views, so this number is usually higher than Unique Users.
Unique Users - how many different people opened the tour within the time range.
Avg. Time (min) - average time visitors spent in the tour, in minutes.
Navigation Clicks - how many times visitors clicked on navigation destinations (tags / areas) to start wayfinding.
Bounce Rate - the share of visits that ended without any interaction with navigation.
Activity Over Time
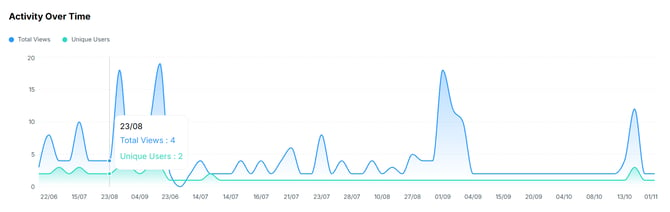
The graph shows Total Views and Unique Users for each day of the selected period. Hover over the graph to see the exact numbers for a specific date.
Kiosk Entries (Kiosk tab only)
A log of the navigation sessions started on kiosk screens within the selected period. If there were no kiosk sessions, you will see the message “No kiosk sessions in the selected range”.

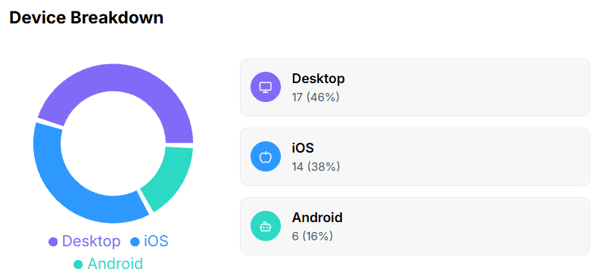
Device Breakdown (Web / Mobile tab only)
The chart shows which devices visitors used to open the tour: Desktop, iOS or Android. Next to the chart you can see the number of visits and the percentage for each device:
Navigation Success (Web / Mobile tab only)
Shows the percentage of navigations that were completed, that is, the visitor reached the selected destination:
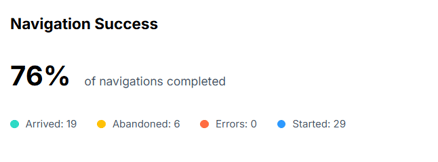
Below the percentage, navigations are split by status:
Started - navigations that visitors started;
Arrived - navigations where the visitor reached the destination;
Errors - navigations that ended with an error;
Abandoned - navigations the visitor started but did not finish.
Error Rate (Web / Mobile tab only)
Shows navigation errors within the selected period. Use the filter to view errors on All devices or on a specific device: iPhone (iOS), Android or Desktop. If there were no errors, you will see the message “No navigation errors in the selected range”:

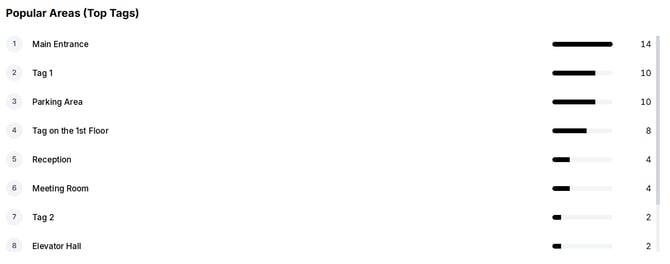
Popular Areas (Top Tags)
A ranking of the tour areas (tags) that visitors navigated to most often, from the most to the least popular. The bar and the number next to each area show how many times it was selected as a destination:
Latest Feedback
Shows the latest ratings and comments that visitors left about the tour. If nobody has rated the tour yet, you will see the message “No ratings yet for this tour”.

If you have further questions or need assistance with the settings, please contact us at support@treedis.com